

Welcome to the first entry of PML Next Gen Stats as we take an inside look at the QBs around the league. The goal is to get a comprehensive efficiency score that attempts to be more in depth than the traditional QB rating. In the NFL, the QBR score was developed back in 2011 on a scale of 0-100 and is much more analytically driven than the traditional QB rating (0-158.3 scale) which relies on a handful of box score stats (only attempts, completions, TDs, INTs, and yards).
Now because this is madden, we are still limited in what kind of analytics we can draw from. However, with this rating system we are trying to not just see the numbers on completions and attempts, but also what kind of passes each QB is completing and how that stacks up against the league’s average. To do this, we are looking at the “Average Air Yards per Pass Completion” which can be found by looking at the team’s total receiving yards and subtracting the team/s total yards after catch and then dividing that number by the team’s total pass attempts. This number isn’t perfect for every QB because some teams have more than one QB with a decent number of pass attempts, but we can’t break down the number to see which QB contributed to which WR’s yards and YAC totals so we are taking the team’s Air Yards stat and just applying it to every QB on the team that’s attempted at least 100 passes.
Another thing we are doing is trying to scale the difference between madden TD:INT ratios and real NFL TD:INT ratios. Obviously, INTs are thrown at a much higher rate in Madden than in real life and TDs are also thrown at a much higher rate than in real life. The QB rating we get in the game is based off the real NFL calculations of what’s considered good and bad in terms of TDs and INTs. So with our “TD Rating” and “INT Score” grades, we are using the formulas to scale them differently than the real QBR formula is done.
Here are the Top 5 finishers in each analytical stat category that ultimately contribute to the PML QBR Ratings at the end. I will be posting the results for all of the QBs from each division shortly after this. Use this article as a guide to what each stat means how we get the formula.
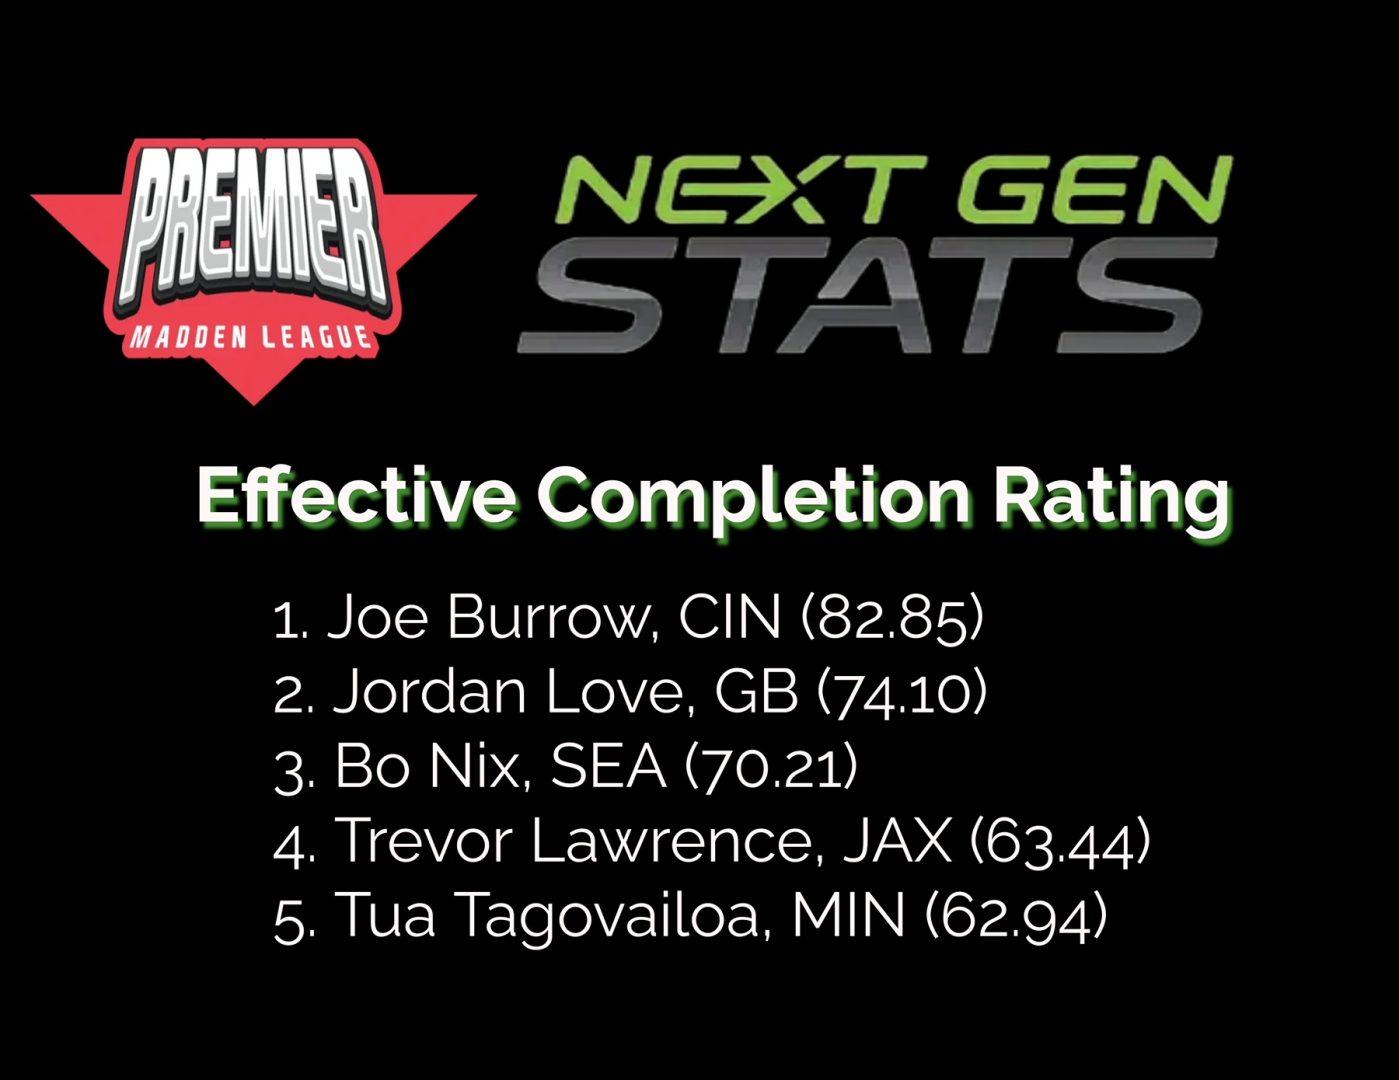
Effective Completion Rating – This is the most complex analytical stat category. It’s looking at the average air yard distance per completion of the QB and their total completion percentage and weighs that against the league’s average completion percentage and 2/3 of the league’s average air yard completion distance.
So, for each QB I took his average air yards per completion and multiplied that by his completion percentage, then divided that total number by the league’s average completion percentage, then took that number and multiplied it by 6 (2/3 of PML’s average air yards per comp which is 9).
n = [(A*B)/C]6 , if A is the QBs average air yards per comp, B is the QBs comp %, and C is the league’s average comp %
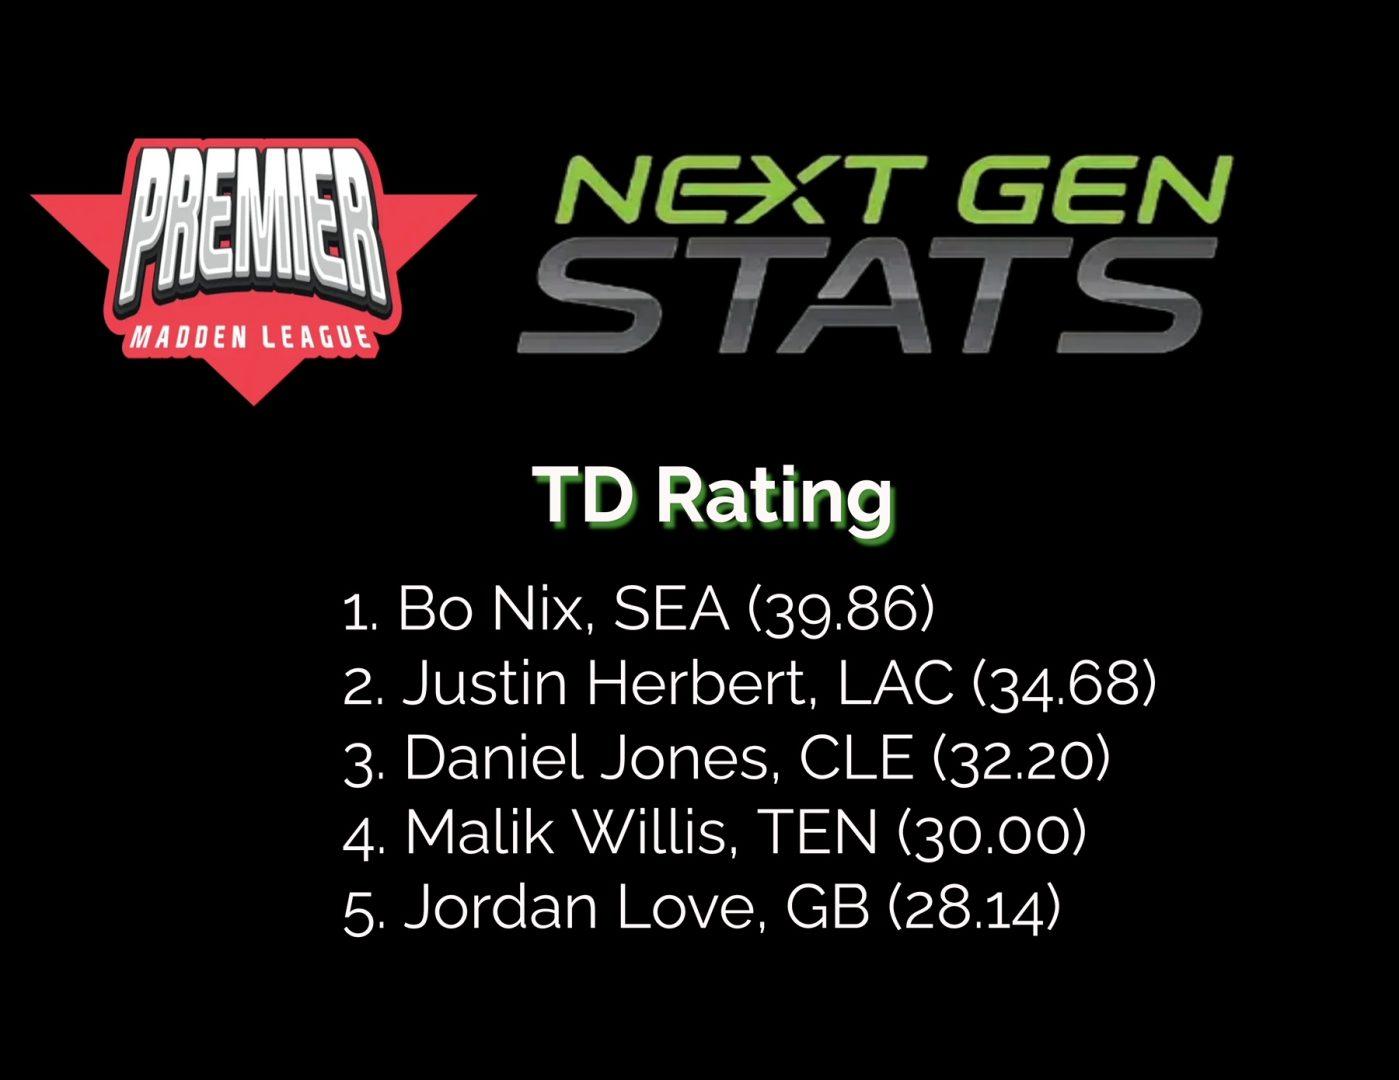
TD Rating – This formula is a little easier to look at and all it’s looking at is the Passing TD rate of the QB and multiplying that by 2.7. The 2.7 is to scale the TDs proportionately against INTs which you will see be multiplied by 3.5. Basically, it’s saying that an “average” season performance in PML would be around 30 passing TDs and 22 INTs. This differs from the real NFL where average would be seen as around 22 Passing TDs and 10 INTs. We are using the inverse of the average ratio to multiply the TDs and INTs to balance the two grades against each other. So, a QB that throws 35 TDs and 27 INTs will have their TD Rating and INT Score cancel each other out to total 0 .
n = (A/B)2.7*100 , where A is the QB’s passing TDs and B is the QBs total attempts. this gives us a percentage fraction which is why I multiplied that by 100 at the end to get a regular number.
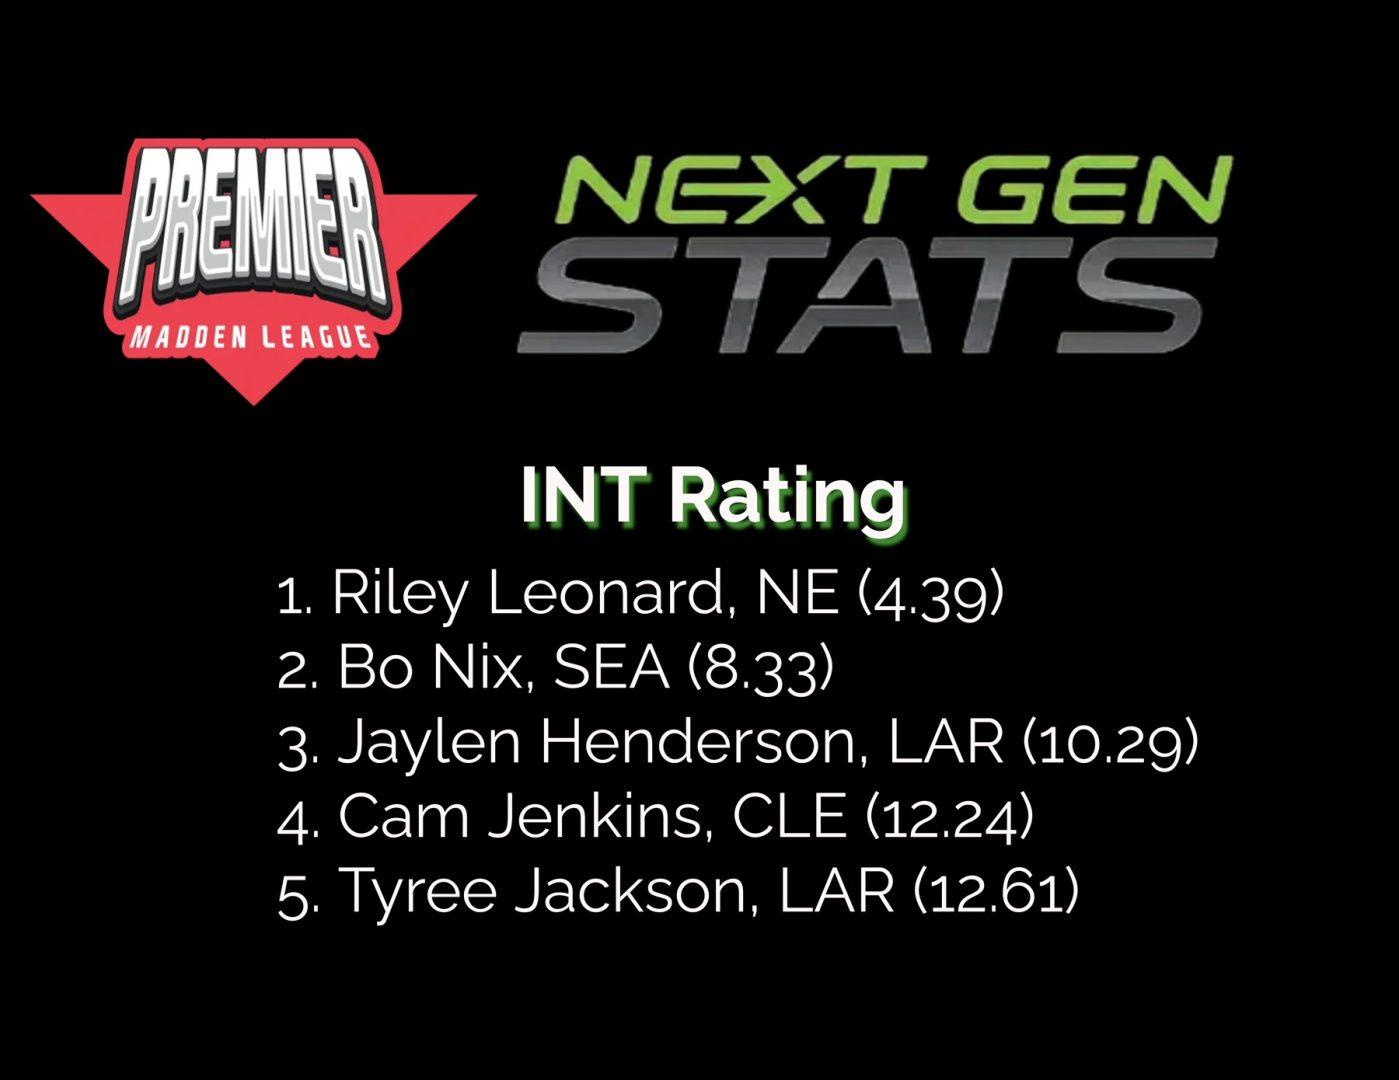
INT Rating – This is basically the same at the TD score but for INTs. We are finding the INT rate of the QB and multiplying that by 3.5
n = (A/B)3.5*100 , where A is the QBs INTs and B is the QBs total pass attempts.
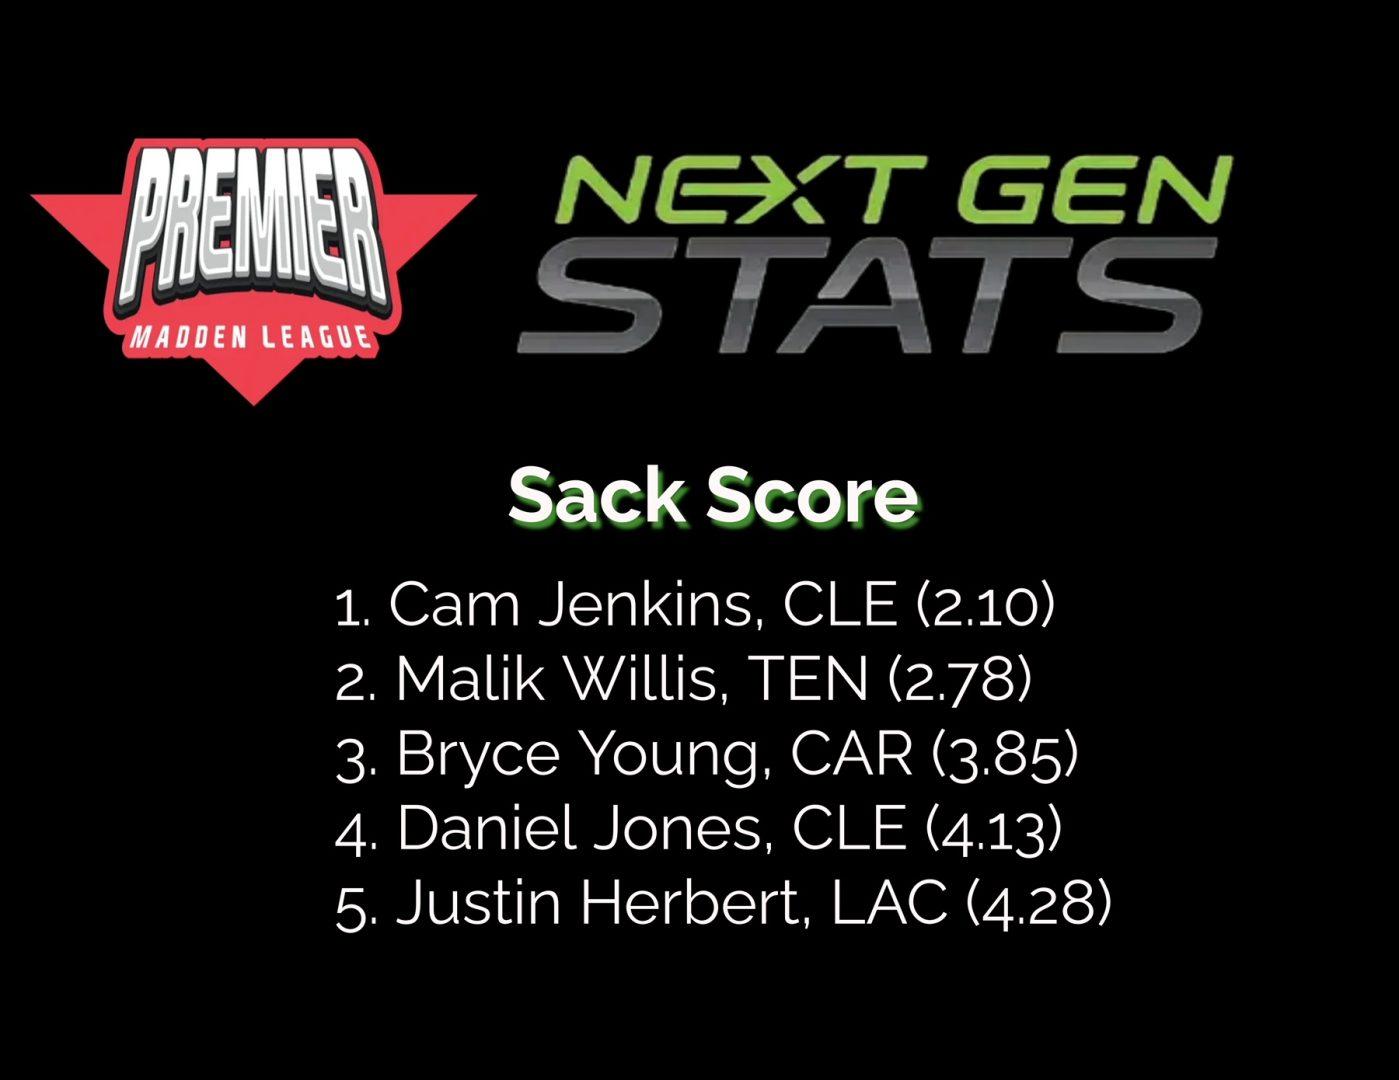
Sack Score – This is the easiest grade to look at, it is just finding the QB’s sack rate and multiplying it by 100 to turn it from a percentage fraction into a whole number.
n = (A/B)100 , where A is the total number of sacks taken by the QB and B is their total pass attempts. If you scale this against the INTs as a negative play, INTs are 3.5 times worse than a sack.
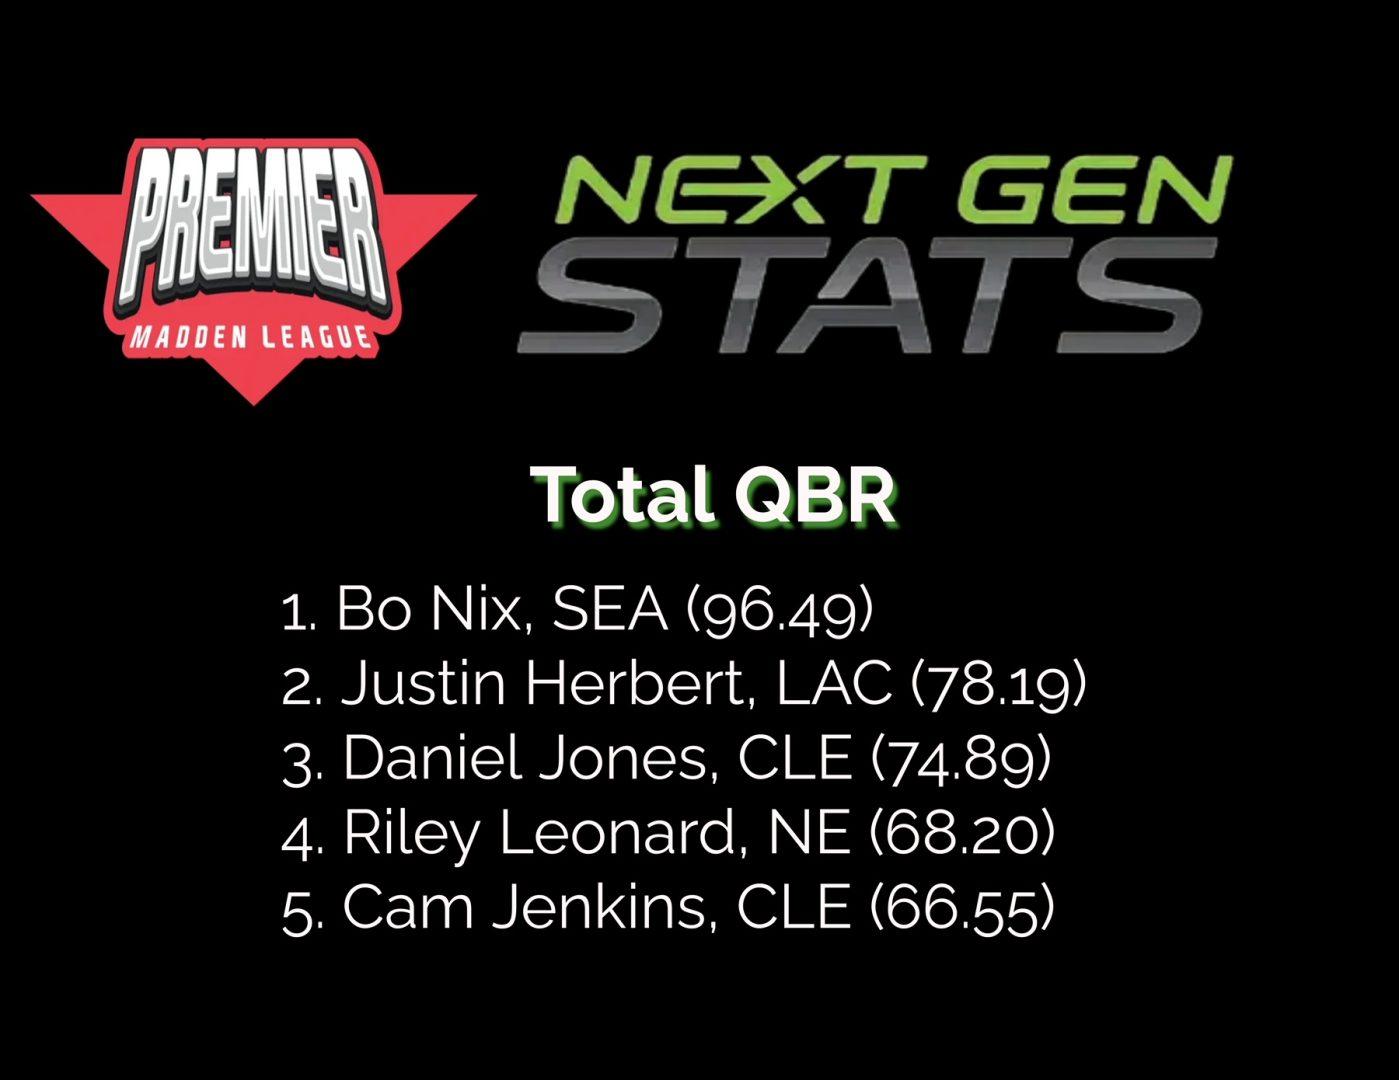
Total QBR – This is the ultimate number we are finding! The QBR is the one number that combines the other formulas to give us our best look at efficiency. For each QB we are seeing their average air yards per completion and their completion percentage stacked up against the league averages in both categories, plus their TD rating, and then taking that total number of the two and subtracting the INT Score and Sack Score to find the total QBR. So the best QBs will have completed passes near or above the league’s average air distance at a completion percentage higher than the league’s average, while also throwing a high number of TDs compared to their number of pass attempts and a low number of INTs compared to their number of pass attempts while also not taking many sacks.
n = (A+B) – (C+D) , where A is the Effective Completion Rating, B is the TD Rating, C is the INT score, and D is the Sack Score.
This is scaled 0-100 just like the real NFL’s 0-100 QBR. The NFL’s model is aimed to make a grade of 45-55 be an average NFL starter and 70-80 be a pro bowl/All-Pro season. Anything above 90 is almost unheard of and doesn’t happen every season. I worked tirelessly on this formula for it to create the same scale and I think I accomplished as close to that as I could based on what we know about each user and can see from the plain stats while also unearthing some odd outliers of stats (Like Matigy having the 2nd lowest average air yards per completion at 5.9yds or Silent averaging over 13 yards per completion while the rest of the league is below 10).
- Below 30 = bad
- 31-45 = below average PML Starter
- 46-60 = average to above-average PML Starter
- 61-70 = very good PML starter
- 70-90 = top tier PML QB, the league’s best
- 91+ = Bo Nix